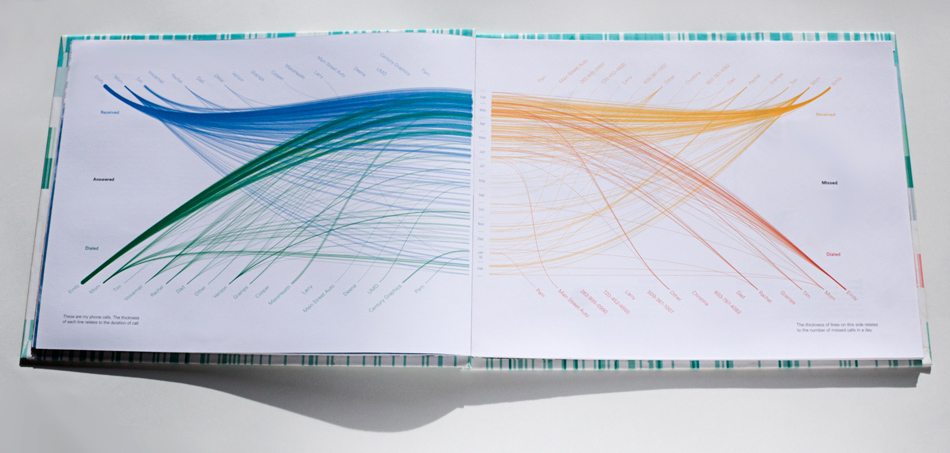
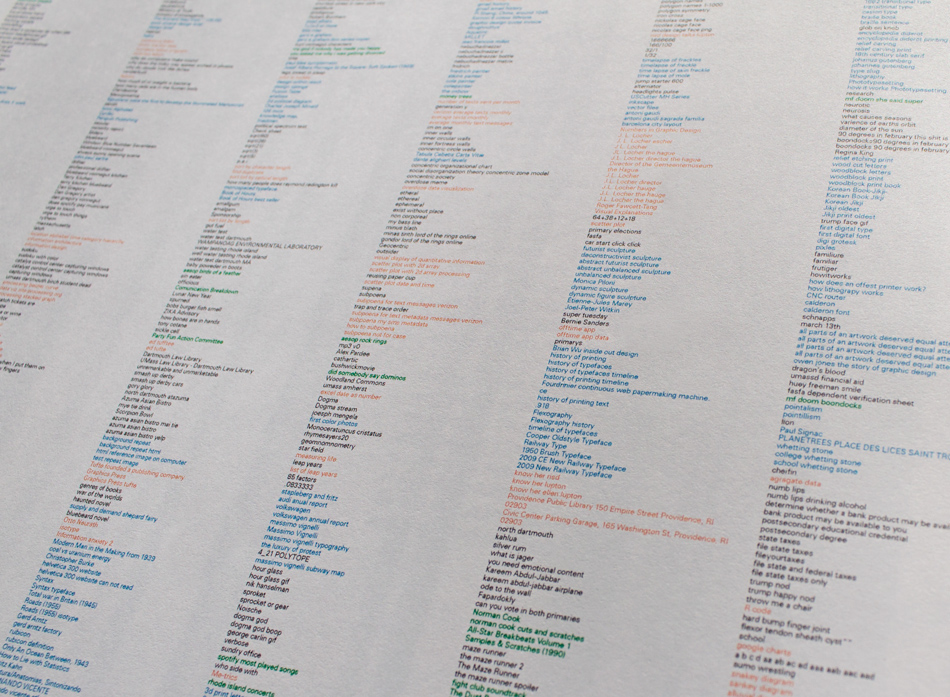
Using data I collected about some of my daily habits, this book explores the way information is understood and the beauty numbers can have. It is difficult to see what is happening in a spreadsheet by looking at the cells. Visualizing the values as shapes makes hidden patterns emerge. There are graphics showing the times I wake and sleep, names of everyone I talked to, texts, calls, computer use, Google searches, books read, booze consumed, and more. I also printed and bound this book.